Introduction
Every quarter, chief executives and financial officers face the same recurring dilemma: how to make high-stakes technology decisions without knowing their downstream financial and operational consequences.
Whether evaluating a multi-million-dollar core banking overhaul, planning a cloud migration, or attempting to slash redundant software across business units, leaders are trapped between two unappealing options:
- Experiment on production systems: Run reorganizations and budget cuts live, risking catastrophic outages, regulatory penalties, and employee burnout.
- Rely on static, siloed spreadsheets: Build high-level financial models in Excel that ignore operational dependencies, vendor lock-ins, and shared infrastructure costs.
This article introduces the concept of the Enterprise IT Digital Twin - a mathematically rigorous, statistically realistic synthetic simulation environment where executive leadership can test financial strategies, stress-test cost optimizations, and model organizational changes before committing a single rupee of capital or changing a line of code.
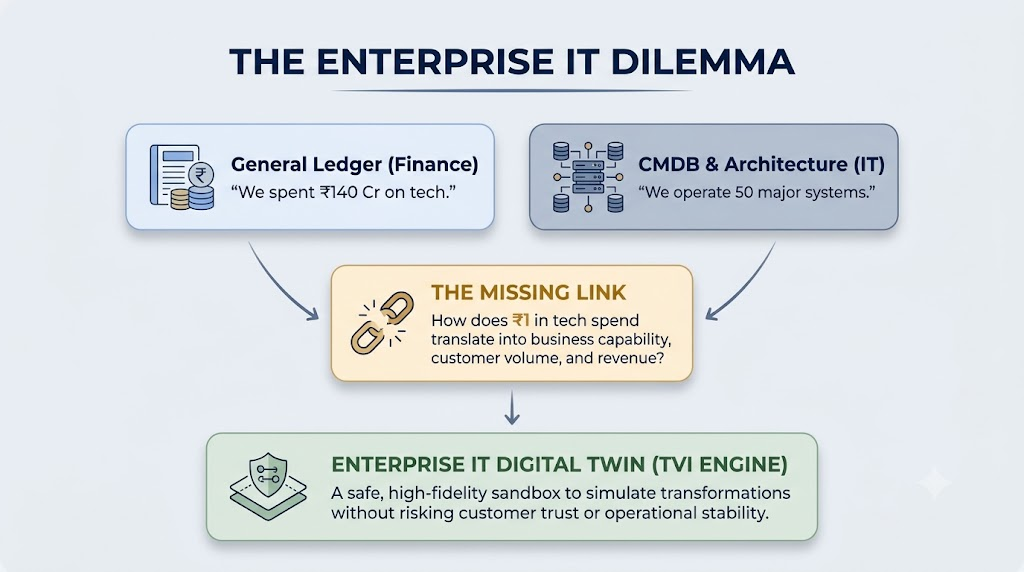
The Enterprise Challenge: Why Real Data is Hard to Share and Harder to Model
In an ideal world, technology financial management would be conducted on real-time, perfectly clean enterprise data. In reality, large enterprises face three insurmountable barriers:
1. Data Privacy and Regulatory Redlines
Modern financial systems contain sensitive general ledger details, confidential vendor pricing, employee salaries, and customer transaction volumes. Regulations such as GDPR, DPDP, HIPAA, and PCI-DSS strictly prevent enterprise architects, external strategy consultants, and data science teams from freely sharing raw production databases. As a result, strategic planning takes place on redacted, aggregated, or outdated extracts.
2. Disconnected Data Islands
Enterprise data does not live in one place:
- Finance maintains the Chart of Accounts in SAP or Oracle ERP (tracking vendor invoices and depreciation).
- IT Operations logs compute instances, storage volumes, and network packets in AWS, Azure, or Datadog.
- Enterprise Architecture tracks application catalogs and capabilities in ServiceNow or LeanIX.
- The PMO tracks project milestones and capital expenditure in Jira or Planview.
Because these databases do not share a common semantic schema, no single system can answer simple business questions: “If we terminate Vendor X’s contract, how many retail banking workflows fail?” or “What is our fully-burdened cost per loan application?”
3. The “Clean Data” Illusion
Real enterprise data is messy, riddled with missing foreign keys, misclassified cost centers, and arbitrary naming conventions. However, waiting 18 months for a multi-million-dollar data warehouse cleanup program before making strategic decisions is a luxury modern businesses cannot afford.
The Solution: A Statistically Grounded Digital Twin
Rather than relying on brittle mock data or risking production databases, I propose to establishe an Enterprise Digital Twin built on synthetic generation principles.
A true digital twin is not a random collection of fake numbers. It is a statistically calibrated representation of enterprise reality, engineered to mirror the exact mathematical behaviors, cost curves, and operational pathologies observed across Global 2000 IT environments.
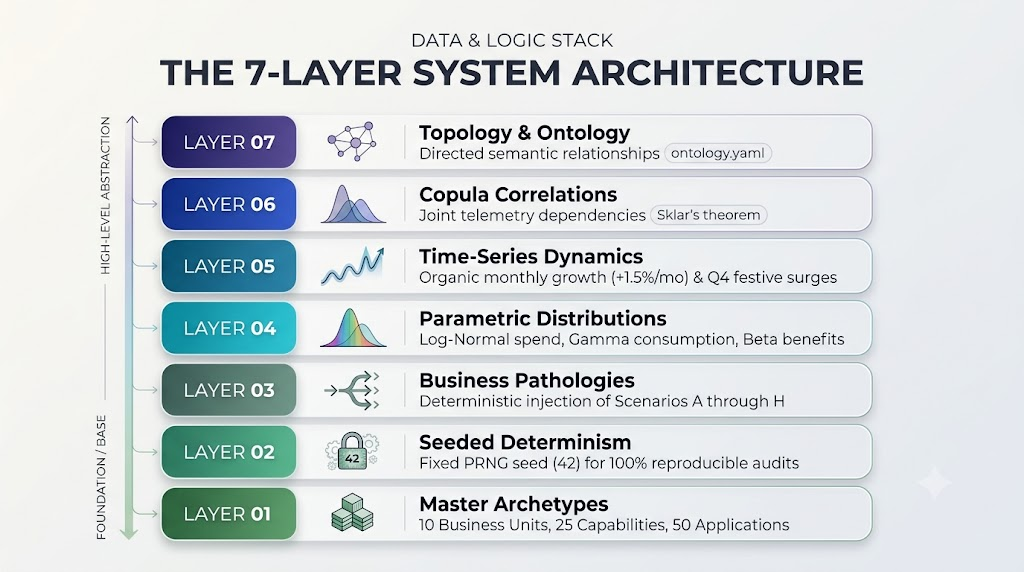
The 7 Layers of Enterprise Synthesis
Why Statistical Fidelity Matters to Business Leaders
To evaluate strategic options reliably, the simulation must behave like a living enterprise:
- Heavy-Tailed Cost Distributions (Log-Normal): In real life, software spend is not evenly spread. A tiny handful of massive core platforms account for the vast majority of spend, while dozens of smaller tools form a long tail. The TVI twin uses Log-Normal distributions (μ=16.2,σ=0.75μ=16.2,σ=0.75) to mirror this natural enterprise skew.
- Coupled Operational Telemetry (Gaussian Copulas): When digital transaction volume spikes during a festival, active users, API calls, and cloud compute hours do not move independently; they surge together in a correlated wave. By applying Sklar’s theorem and rank correlation matrices, our digital twin preserves realistic multi-variate dependencies.
- Seasonal Spikes and Macro Trends: Real business budgets experience organic monthly drift (+1.5% month-over-month) alongside dramatic seasonal spikes (such as Diwali or Q4 retail surges). The model injects deterministic seasonal multipliers so CFOs can evaluate elasticity under real-world stress conditions.
What Can We Simulate?
With an Enterprise Digital Twin in place, executive teams can execute “dry-run transformations”:
| Executive Scenario | Traditional Approach | Digital Twin Simulation |
|---|---|---|
| M&A Tech Integration | Spend 6 months reviewing vendor contracts post-merger; discover duplicate CRM systems after paying renewal fees. | Ingest the acquired entity’s application catalog; identify overlapping capabilities (e.g. Order-to-Cash duplication) on Day 1. |
| Cloud Migration Strategy | Lift-and-shift existing virtual machines based on peak server capacity; face a 200% cloud bill surprise 6 months later. | Simulate dynamic auto-scaling against historical transaction curves; quantify unit cost shifts before migrating. |
| Vendor Contract Renegotiation | Meet vendors with high-level invoice summaries; accept standard 5% annual price increases. | Traverse the graph from the vendor to all dependent business capabilities; assess true vendor leverage and alternative exit options. |
| Budget Rationalization | Issue an across-the-board 10% IT budget cut, inadvertently crippling high-volume customer transaction engines. | Filter out systems with high unit costs and low user volumes while protecting critical high-volume workhorses. |
Decision Velocity with Zero Risk
By decoupling strategic experimentation from production data, organizations gain an unprecedented advantage: Decision Velocity.
- Safe Collaboration: Corporate strategy teams, external advisory partners, and FinOps engineers can analyze the exact structure of the enterprise without triggering security clearance protocols or non-disclosure delays.
- Repeatable Testing: Because every simulation is governed by deterministic seeds (
random_seed: 42), business cases presented to the Board of Directors can be reproduced and audited down to the exact rupee. - Scenario Stress-Testing: Leaders can intentionally inject adverse conditions—such as a 30% drop in transaction volume or a 40% vendor price hike—to see which business capabilities break first.
Boardroom Action Checklist
- Audit Data Access Latency: How long does it currently take your enterprise architecture and finance teams to answer a multi-system cost attribution question? (If > 2 weeks, your organization is suffering from data silo paralysis).
- Establish a Synthetic Sandbox Policy: Create a standardized digital twin environment for your transformation PMO to prototype IT business cases before signing supplier commitments.
- Demand Unit Economics Over Aggregate Budgets: Require all technology program sponsors to present projected cost-per-transaction and cost-per-user models generated through simulation rather than high-level capital expenditure summaries.
In the next article, we examine the 8 Hidden Pathologies of Enterprise Technology Spend, detailing the exact operational anomalies and budget traps that every technology leader must learn to detect.