The TBM Problem: Why Traditional IT Management Fails
If you are new to Technology Business Management (TBM), the central challenge of enterprise IT can be summarized in a single paradox:
The Enterprise IT Paradox: The General Ledger (GL) tracks IT expenditures as accounting lines (e.g., invoices from AWS, payroll for software engineers, Cisco hardware leases), but business executives demand to know the financial return of business capabilities (e.g., “What does our Customer Loan Origination process cost per transaction?”).
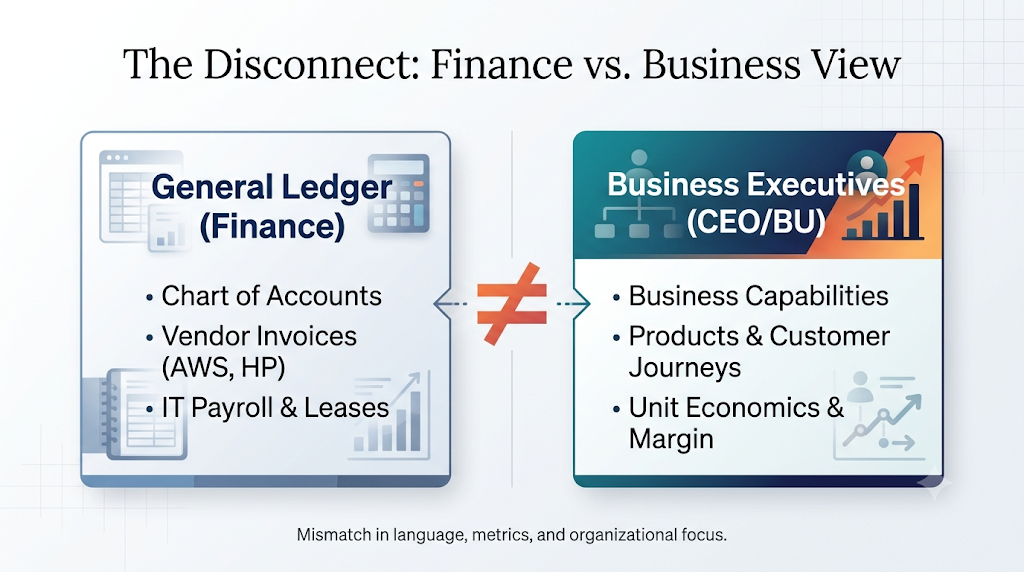
Without an intermediary model, IT organizations resort to “peanut-butter budgeting” - taking the massive pool of IT costs and smearing it evenly across business units based on arbitrary metrics like employee headcount. This distorts decision-making:
- Low-cost, efficient business units subsidize legacy, bloated departments.
- Architects cannot determine whether decommissioning a legacy monolith will save ₹10,00,000 or ₹10 Crore.
- FinOps teams optimize server instances without understanding which customer journey relies on them.
To solve this, TBM introduces a standardized taxonomy (such as the Apptio TBM Unified Model, or ATUM) that maps expenditures across four layers:
Cost Pools (Invoices) -> Cost Towers (Infra/Apps) -> Applications/Services -> Business Capabilities / UnitsCost Pools (Invoices) -> Cost Towers (Infra/Apps) -> Applications/Services -> Business Capabilities / Units
Why Synthetic Enterprise Data is Mandatory
Enterprise IT cost structures, vendor contracts, and dependency graphs contain strict intellectual property, personally identifiable information (PII), and confidential financial margins. You cannot open-source or benchmark real Fortune 500 General Ledger data.
To demonstrate production-grade TBM algorithms, we construct an end-to-end procedural synthetic data generator. It models a realistic ₹140 Crore+ enterprise IT estate across 25 applications, 6 business units, 10 business capabilities, and 12 months of operations.
Core Architectural Entities & Relationship Taxonomy
Our enterprise ontology models entities as typed relational tables that subsequently compose a typed property graph:
Entity Specifications
- Organization (
ORG001): Top-level corporate entity (Global Financial Enterprises). - Business Units (
BU001-BU010): 10 operating divisions (Retail Banking, Corporate Investment, Wealth Management, Digital Payments, Operations & Risk, Core Platform, Treasury & Capital Markets, Consumer Lending, Asset Management, Commercial Banking). - Business Capabilities (
CAP001-CAP025): 25 high-level business capabilities (e.g., Core Banking, Payment Processing, Loan Origination, Wealth Advisory, Order-to-Cash, Procure-to-Pay, Fraud Detection). - IT Services (
SRV001-SRV018): 18 technical and shared platform services. - Applications (
APP001-APP050): 50 systems of record, customer portals, integration middleware, and analytics engines categorized across four criticality tiers. - Technologies (
TECH001-TECH035): 35 infrastructure, runtime, database, and cloud components. - Vendors (
VEN001-VEN010): 10 major cloud, software, and hardware providers (e.g., TechNova Cloud, Apex Systems, CloudScale Solutions). - Transformation Projects (
PRJ001-PRJ040): 40 strategic initiatives tracking budget, actual spend, and realized value.
Architectural Decisions & Alternatives
| Architectural Choice | Choice in TVI | Alternative 1: Faker / Mockaroo | Alternative 2: SDV (CopulaGAN/CTGAN) | Alternative 3: Anonymized Production Dump |
|---|---|---|---|---|
| Generation Engine | Deterministic Procedural Python | Template-driven random generation | Neural generative adversarial network | SQL scrubbing / masking script |
| Referential Integrity | Strict Relational & Graph GraphML Checks | Loose foreign keys | Probabilistic joins (often broken) | Native database constraints |
| Reproducibility | Fixed seed (seed=42) across NumPy/Python |
Seeded templates | Stochastic random weights | Non-reproducible (schema drifts) |
| Compute Overhead | < 1.5 seconds on 16 GB laptop | < 1 second | 10-30 minutes GPU training | Hours of sanitization pipelines |
| Why TVI Chose This | Complete mathematical control over 25 injected edge-case scenarios | Cannot enforce complex graph dependencies or financial balance | Overkill; hallucinates referential graph violations | Legal liability and enterprise NDA breach risk |
Code Walkthrough: Procedural Entity Synthesis
Let’s examine the foundational generator class [EnterpriseDataGenerator](file:///Users/pushkar/Documents/projects/value/src/tvi/data_generation.py#L30-L75).
# src/tvi/data_generation.py
import random
import numpy as np
import pandas as pd
from typing import Dict, List, Tuple
from tvi.config import load_config

class EnterpriseDataGenerator:
    \"\"\"Generates realistic enterprise IT cost, consumption, and topological data.\"\"\"

    def __init__(self, config: Dict = None, seed: int = 42):
        self.config = config or load_config()
        self.seed = seed
        random.seed(seed)
        np.random.seed(seed)

        # Internal state stores
        self.applications: pd.DataFrame = None
        self.business_units: pd.DataFrame = None
        self.cost_centers: pd.DataFrame = None
        self.capabilities: pd.DataFrame = None
        self.cost_records: pd.DataFrame = None
        self.consumption_records: pd.DataFrame = None
Line-by-Line Code Analysis:
- Lines 10–14: Dual random state seeding (
random.seed(seed)andnp.random.seed(seed)). This guarantees that every synthetic dataset, variance spike, and dependency graph generated will produce bit-for-bit identical results on macOS, Linux, and Windows. - Lines 17–23: Data stores are typed as
pd.DataFrame. DataFrames provide immediate columnar conversion to Apache Parquet and DuckDB memory structures.
Application Catalog Generation
Applications require realistic tiering, architectural complexity, vendor ownership, and operational lifecycles:
def generate_applications(self) -> pd.DataFrame:
    \"\"\"Generates 25 enterprise applications across tiers and lifecycles.\"\"\"
    apps_data = [
        {"app_id": "APP001", "app_name": "Core Banking Engine", "tier": "Tier 1",
         "lifecycle": "Production", "owner_bu": "BU001", "criticality": 0.95},
        {"app_id": "APP002", "app_name": "Retail Mobile Banking", "tier": "Tier 1",
         "lifecycle": "Production", "owner_bu": "BU001", "criticality": 0.90},
        # ... APP003 through APP025
        {"app_id": "APP021", "app_name": "Legacy Branch CRM", "tier": "Tier 3",
         "lifecycle": "Legacy", "owner_bu": "BU005", "criticality": 0.30},
    ]
    self.applications = pd.DataFrame(apps_data)
    return self.applications
Notice the criticality score ∈[0,1]∈[0,1]. In later notebooks, this score forms a primary weight in Multi-Criteria Decision Analysis (MCDA) for application rationalization and transitive blast-radius simulations.
Scope of Improvement & Production Roadmap
- Hierarchical Capability Taxonomies: Upgrade from a single-tier capability catalog to a full 3-level BIAN (Banking Industry Architecture Network) capability tree.
- Dynamic Configuration Ingestion: Allow developers to inject an enterprise’s real Application Portfolio Management (APM) taxonomy via YAML schema overrides.
- Distributed Synthesis: For stress-testing billion-row datasets, parallelize row generation using Ray or Polars.
Summary & Companion Reading
In this first technical guide, we established the core rationale for TBM and implemented deterministic procedural generation for corporate entities.
Next Guide explores why IT metrics break standard Gaussian distributions.