Foundational Cost, Utilization & Scale
Scenario A (SCN-01): The “Scale Anchor”
Representative Asset: Enterprise Core Banking Engine (APP001)
Category: Cost & Utilization
-
The Executive Trap: Finance teams searching for quick savings immediately flag
APP001because its annual Total Cost of Ownership (TCO) exceeds ₹15.8 Crore, with annual software licensing alone reaching ₹2.8 Crore. It appears as the single largest line item on the corporate IT ledger. Corporate controllers routinely ask: “Can we cut this maintenance contract by 20%?” -
The Operational Reality:
APP001is the ultimate enterprise workhorse. It serves 8,500 active enterprise users and processes over 6,500,000 core transactions every month. Calculating fully-burdened unit economics reveals:The system produces an ultra-low unit cost far below the enterprise benchmark threshold (≤₹0.05/txn≤₹0.05/txn).
-
The Graph & Analytical Signal: DuckDB aggregations confirm that while absolute spend is in the 99th percentile of the portfolio, unit cost is in the 1st percentile. NetworkX graph queries show it sits at the absolute center of revenue generation, with zero redundant duplicate systems.
-
Executive Guidance: Protect the Anchor. Do not make arbitrary across-the-board cuts to scale anchors. Slashing engineering capacity or maintenance on
APP001to save ₹1 Crore jeopardizes the transactional backbone that generates hundreds of crores in gross margin at two paise per transaction.
Scenario B (SCN-02): The “Zombie Legacy System”
Representative Asset: Legacy Branch Portal (APP021)
Category: Application Rationalization
-
The Executive Trap:
APP021incurs a modest annual spend of ₹8.4 Crore (with ₹1.8 Crore in software licensing). Because its absolute cost is half that of core banking, it flies beneath corporate scrutiny, auto-renewed year after year by procurement managers who assume someone is using it. -
The Operational Reality: Operational telemetry reveals that
APP021serves only 140 active monthly users and handles an anemic 45,000 requests per month. Its unit cost economics are catastrophic:The enterprise is spending ₹60,000 each month just to keep a single employee logged into an obsolete terminal.
-
The Graph & Analytical Signal: Graph traversal reveals that
APP021duplicates capabilities already provided by modern platformsAPP002(OmniCRM) andAPP011(Digital Branch Hub) acrossCAP001(Account Management) andCAP008(Customer Engagement). -
Executive Guidance: Target for Immediate Decommissioning. Decommission
APP021, migrate its 140 users onto modern platforms, sever its legacy database links, and capture up to ₹8.4 Crore in annual avoidable cost.
Scenario C (SCN-03): The “Duplicate Capability Overlap”
Representative Asset: Order-to-Cash Capability (CAP003)
Category: Capability Architecture
-
The Executive Trap: Divisional silos operate independently. Corporate Logistics defends
APP005(OrderFlow Strategic), while Wholesale Commercial defendsAPP012(QuickOrder Legacy), claiming their workflows are uniquely specialized. -
The Operational Reality: Semantic mapping proves both systems fulfill the identical business capability:
CAP003Order-to-Cash.APP005handles 70% of enterprise order volume at an annual TCO of ₹6.8 Crore.APP012handles 30% of enterprise order volume at an annual TCO of ₹4.2 Crore.- The enterprise pays two separate vendor maintenance fees, supports two separate database clusters, and retains two specialized external support teams.
-
The Graph & Analytical Signal: Bipartite capability graph mapping reveals multi-parent redundancy:
-
Executive Guidance: Consolidate onto Strategic Platform. Standardize the Order-to-Cash capability onto
APP005. Migrating the 30% volume offAPP012unlocks ₹3.75 Crore in annual net avoidable costs after factoring in contract termination amortization.
Scenario D (SCN-04): The “Single Point of Failure (SPOF)”
Representative Asset: Central Authentication Hub (APP010)
Category: Graph Topology & Risk
-
The Executive Trap:
APP010has a modest annual operating budget of ₹3.2 Crore. It generates no direct customer revenue and sells no products, so it rarely receives modern engineering attention or executive sponsorship. -
The Operational Reality: Topological graph analysis uncovers that 8 Tier-1 mission-critical enterprise platforms directly depend on
APP010:APP001(Core Banking),APP002(Retail Mobile),APP004(Treasury Engine),APP005(OrderFlow),APP006(Payment Gateway),APP007(Commercial Lending),APP008(Workforce Central), andAPP009(Global FX).- If
APP010suffers an outage, 64% of total enterprise revenue transactions halt instantaneously.
-
The Graph & Analytical Signal: NetworkX reverse-dependency traversal computes an in-degree centrality score in the 99th percentile and a catastrophic direct blast radius:
-
Executive Guidance: Fund Resiliency & Gated Deployment. Do not optimize
APP010for cost. Ringfence its budget, deploy active-active multi-region redundancy, and mandate that any code release toAPP010pass through automated deployment gating.
Scenario E (SCN-05): The “Transformation Outperformer”
Representative Asset: Real-Time Payment Modernization (PRJ003)
Category: Technology Value Realization (TVR)
- The Executive Profile:
- Approved Capital Budget: ₹12.0 Crore
- Actual Capital Incurred: ₹11.5 Crore (₹50 Lakhs under budget)
- Expected Annual Business Benefit: ₹19.2 Crore
- Actual Realized Business Benefit: ₹20.74 Crore
- Value Realization Ratio (VRR): 108.0%
- Why It Succeeded: The program delivery team tied capital expenditure directly to operational KPIs (Cost per Payment Transaction and Processing Latency). Crucially, the project team conducted monthly post-delivery benefit audits rather than disbanding upon software go-live.
- The Graph & Analytical Signal: TVR linkage graphs trace project funding through application capabilities to customer transaction unit economics, showing sustained downward unit cost trajectory across 12 months.
- Executive Guidance: Study and Replicate. Use
PRJ003as the architectural and governance gold standard for enterprise project delivery.
Scenario F (SCN-06): The “Transformation Benefit Gap”
Representative Asset: Global Legacy CRM Consolidation (PRJ014)
Category: Technology Value Realization (TVR)
- The Executive Profile:
- Approved Capital Budget: ₹25.0 Crore
- Actual Capital Incurred: ₹29.0 Crore (₹4.0 Crore budget overrun)
- Expected Annual Business Benefit: ₹30.0 Crore
- Actual Realized Business Benefit: ₹7.0 Crore
- Unrealized Value Gap: ₹23.0 Crore
- Value Realization Ratio (VRR): 23.3%
- The Post-Mortem: Traditional PMO metrics declared
PRJ014a “success” because software was installed across 40 regional offices. However, operational telemetry reveals that local sales teams rejected the system, customer churn increased, and the promised sales efficiency gains never materialized. - The Graph & Analytical Signal: Benefit waterfall decomposition reveals that 76.7% of projected financial returns dissolved post-delivery due to lack of adoption governance.
- Executive Guidance: Enforce 12-Month Post-Implementation TVR Audits. Never release final capital milestone tranches upon deployment. Mandate that post-go-live stage gates audit actual KPI movements for 12 months.
Scenario G (SCN-07): “Healthy Elastic Scale”
Representative Asset: Digital Payment Gateway (APP014)
Category: Variance & Elasticity
-
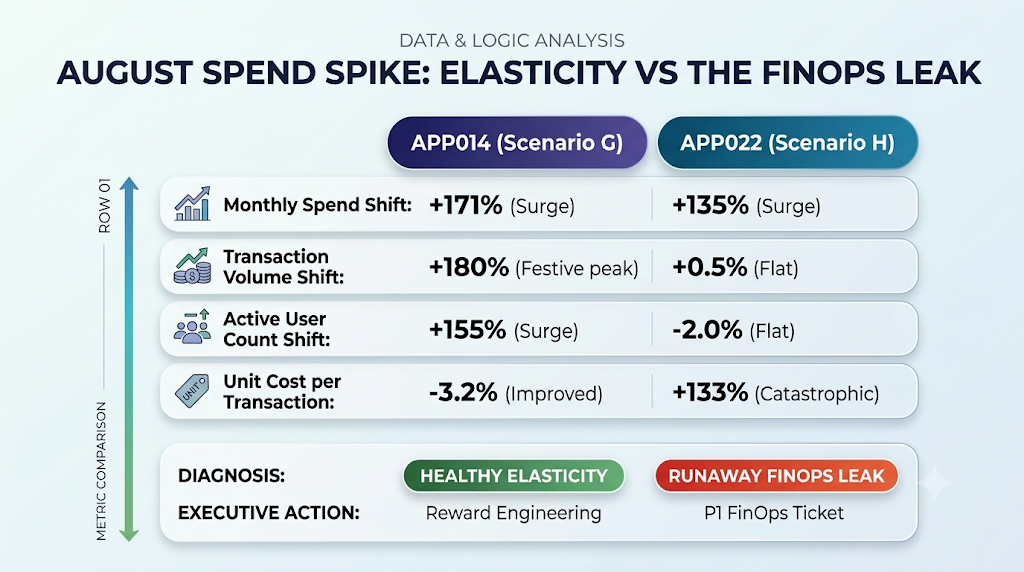
The Month 8 Incident: In Month 8 (August festive peak), monthly cloud spend jumped from ₹45 Lakhs to ₹1.22 Crore (+171% spend surge).
-
The Telemetry Context: Over the exact same period, transaction volume surged by +180% (from 1.2M to 3.36M transactions), and active user concurrency expanded by +155%.
-
The Diagnosis: Healthy Operational Elasticity. Cloud infrastructure auto-scaled out dynamically to capture paying customer volume. Unit costs remained rock-solid:
\delta Unit Cost=\frac{+171% Cost}{+180% Volume}=−3.2% (Marginal unit cost improved) -
Executive Guidance: Reward the Team. Validate that auto-scaling groups automatically scale down post-festive season, but recognize that this spend spike directly generated top-line gross margin.
Scenario H (SCN-08): “The Unbacked FinOps Cost Anomaly”
Representative Asset: Wealth Advisory Engine (APP022)
Category: Variance & Anomaly Detection
- The Month 8 Incident: In Month 8, monthly infrastructure spend surged by +₹38 Lakhs (+135% spend surge), jumping from ₹28 Lakhs to ₹66 Lakhs.
- The Telemetry Context: Transaction volumes were completely flat (< 1.0% change), and active user counts decreased by 2%.
- The Diagnosis: Runaway FinOps Infrastructure Leak. Spend surged while revenue volume did not budge. Root-cause analysis reveals an unoptimized container polling loop, provisioned database IOPS left running in test environments, or expired cloud reservation commitments.
- Executive Guidance: Issue Immediate P1 FinOps Ticket. Trigger algorithmic cost anomaly tickets with rolling Modified Z-score alarms to remediate rate leaks within 48 hours.
To be Continued …
In the next scribble, we will look into intermediate scenarios.